
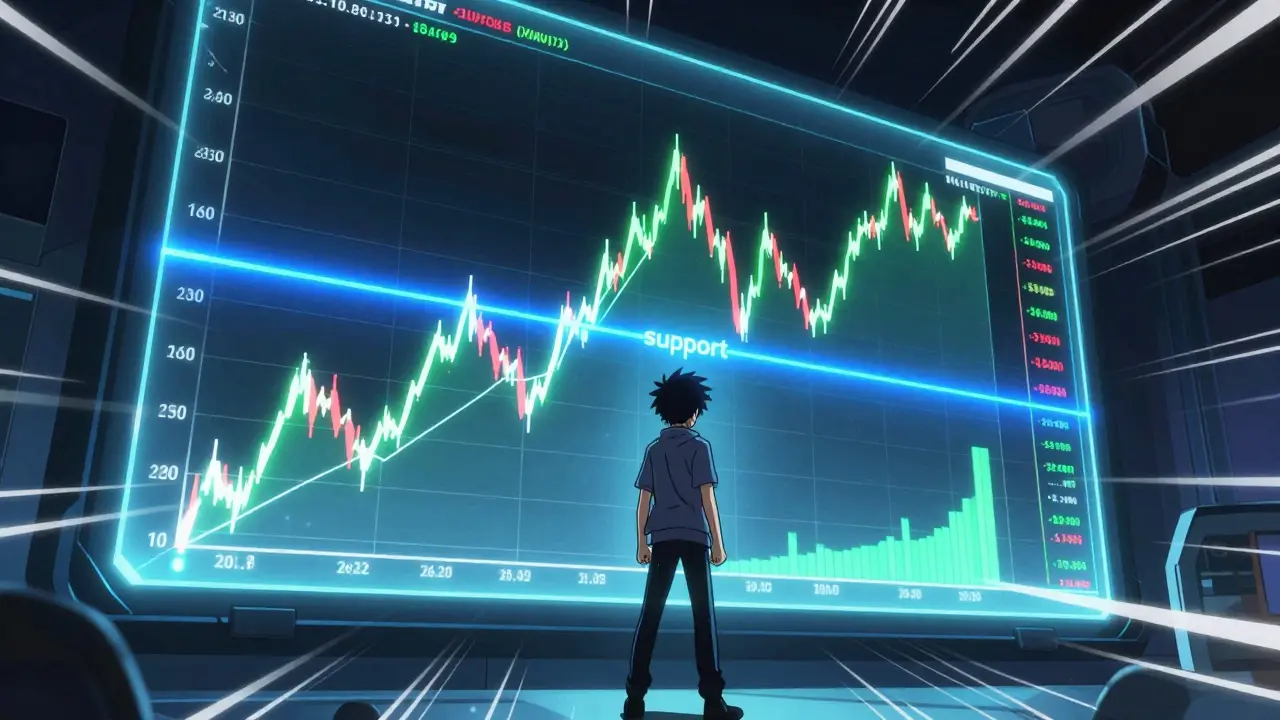
Imagine watching Bitcoin hover exactly at $65,000. It doesn’t crash, it doesn’t skyrocket. It just sits there, bouncing slightly up and down like a ball hitting the floor. Then, suddenly, it breaks through and shoots higher. Or maybe it hits that same number from above, gets rejected, and plummets back down. This isn’t magic. It’s support and resistance, the two most fundamental concepts in cryptocurrency trading.
If you are new to the charts, these terms might sound like jargon invented by Wall Street traders to confuse retail investors. But they are actually simple psychological maps of where money is sitting. In a market that never sleeps, runs on pure sentiment, and moves faster than traditional stocks, understanding these levels is the difference between guessing and knowing.
What Are Support and Resistance?
At its core, trading is about supply and demand. When more people want to buy than sell, prices go up. When more people want to sell than buy, prices go down. Support and resistance are simply the price points where this battle pauses or shifts.
Support is a price level acting as a floor where buying pressure overcomes selling pressure, preventing further price decline. Think of it as a safety net. When the price drops to this level, buyers step in aggressively because they believe the asset is "cheap" here. They place limit buy orders, creating a wall of demand that stops the fall.
Resistance is the opposite. It is a price level acting as a ceiling where selling pressure overcomes buying pressure, preventing further price increase. Here, sellers dominate. Early holders who bought low see their profits growing and decide to take them. New buyers get scared off by the high price. The result? The price bounces off this ceiling and falls back down.
The key thing to remember is that these are not exact lines drawn with a laser. They are zones. Prices are messy. Bitcoin might touch $64,950, wick down to $64,800, and then bounce back to $65,100. That entire range is the support zone. Treating them as rigid lines leads to bad trades.
Why Do These Levels Form?
You might wonder why price respects certain numbers and ignores others. It comes down to memory and psychology. Markets have a collective memory. If Ethereum bounced strongly from $3,000 three times last year, thousands of traders now remember that $3,000 as a "good entry."
This creates a self-fulfilling prophecy. Because so many traders expect the price to bounce at $3,000, they place buy orders there. Those orders create actual liquidity. When the price approaches, those orders get filled, pushing the price back up. The level works because everyone believes it will work.
Round numbers play a huge role here. Humans love clean integers. $100,000 for Bitcoin, $2,000 for Ethereum, or even $1.00 for smaller altcoins act as massive psychological barriers. Traders cluster their orders around these figures, making them stronger support or resistance zones than random numbers like $99,842.
Institutional players also contribute. Large funds cannot buy millions of dollars worth of crypto all at once without spiking the price. They accumulate slowly near known support levels. Their presence adds depth to the order book, reinforcing the level.
Identifying Key Levels on Your Chart
Finding these levels doesn’t require complex algorithms. You can do it with your eyes and a horizontal line tool. Look for areas where the price has struggled to move past or failed to drop below multiple times.
- Previous Highs and Lows: Look at the chart history. Where did the price reverse sharply before? Those peaks are potential resistance; those valleys are potential support.
- Consolidation Zones: When price moves sideways for days or weeks, it forms a rectangle. The top of that rectangle is resistance; the bottom is support.
- Volume Spikes: Check the volume bars at the bottom of your chart. High volume at a specific price point indicates a significant battle occurred there. These are strong levels.
- Timeframe Matters: A support level on a weekly chart is much stronger than one on a 5-minute chart. Always start with higher timeframes (Daily, Weekly) to find major levels, then zoom in for entries.
A rule of thumb: The more times a level has been tested and held, the stronger it is. However, be careful. Every test weakens the level slightly, like a rope being pulled repeatedly. Eventually, it snaps.
The Flip: When Support Becomes Resistance
One of the most powerful dynamics in technical analysis is the role reversal. When a support level breaks, it often becomes resistance. Conversely, when resistance breaks, it becomes support.
Here is why. Imagine Bitcoin breaks below a long-standing support at $60,000. Traders who bought at $60,000 are now underwater. They are waiting for the price to return to $60,000 so they can break even and exit their losing positions. When the price eventually rallies back up to $60,000, these trapped buyers sell to get out. Their selling pressure turns the old support into new resistance.
This "flip" is a favorite setup for experienced traders. Instead of chasing a breakout immediately, they wait for the price to come back and retest the broken level. If it holds as resistance (in a downtrend) or support (in an uptrend), it confirms the trend change.
| Feature | Support Level | Resistance Level |
|---|---|---|
| Market Action | d>Buying pressure dominatesSelling pressure dominates | |
| Trader Psychology | "It's cheap, let's buy" | "It's expensive, let's sell/take profit" |
| Order Type | Limit Buy Orders cluster here | Limit Sell Orders cluster here |
| After Breakout | Becomes Resistance | Becomes Support |
| Visual Pattern | Double Bottom, Higher Lows | Double Top, Lower Highs |
Breakouts and False Breakouts
A breakout happens when the price closes decisively beyond a resistance or support level. This signals a shift in momentum. A bullish breakout above resistance suggests the path of least resistance is now up. A bearish breakdown below support suggests the path is down.
However, crypto markets are notorious for "fakeouts" or false breakouts. This is when price briefly pierces a level, triggering stop-loss orders and exciting breakout traders, only to immediately reverse direction. This traps traders on both sides.
To avoid getting caught in a fakeout, look for volume confirmation. A genuine breakout should be accompanied by a surge in trading volume. If the price breaks resistance but volume is low, it’s likely a trap. Also, wait for a candle close. Wicks don’t count. You want to see a full candle body close beyond the level on your chosen timeframe.

Combining Indicators for Confirmation
Never trade support and resistance in isolation. Use other indicators to confirm the strength of the level.
RSI (Relative Strength Index) is a momentum oscillator that measures the speed and change of price movements. If price hits support and RSI shows "bullish divergence" (price makes a lower low, but RSI makes a higher low), it’s a strong signal that selling pressure is exhausting. Similarly, if price hits resistance and RSI is overbought (>70), a rejection is likely.
MACD (Moving Average Convergence Divergence) helps confirm trend strength. A crossover of the MACD line above the signal line near support adds weight to a buy signal.
Trendlines also interact with horizontal levels. If a rising trendline converges with a horizontal support level, that intersection is a high-probability bounce zone.
Risk Management: Protecting Your Capital
Even the best support levels fail. Especially in crypto, where news events, whale manipulations, or exchange hacks can wipe out technical patterns in seconds. Therefore, risk management is non-negotiable.
Always use stop-loss orders. If you buy at support, place your stop-loss slightly below the support zone. If the price breaks that level, your thesis was wrong, and you need to exit before losses mount. Don’t hope it will come back. Let the market tell you.
Calculate your position size based on the distance to your stop-loss. Never risk more than 1-2% of your total portfolio on a single trade. This ensures that even if you hit a string of losses, you survive to trade another day.
Remember, support and resistance are probabilities, not guarantees. They help you identify high-reward-to-risk setups. By combining historical price action, psychological insights, and strict risk management, you turn chaotic price movements into structured opportunities.
Are support and resistance levels the same for all cryptocurrencies?
No. Each cryptocurrency has its own unique price history and market participants. While Bitcoin often influences the broader market, altcoins like Solana or Cardano have their own distinct support and resistance levels based on their individual supply, demand, and community sentiment. You must draw levels for each asset separately.
How do I know if a support level is strong?
Strength is determined by frequency and duration. A level that has been tested multiple times over months or years is stronger than one touched twice last week. Additionally, check the volume during previous bounces. High volume at the level indicates strong institutional or retail interest, making it more robust.
What is a "liquidity hunt" in relation to support?
A liquidity hunt occurs when large market makers push the price slightly below a well-known support level to trigger stop-loss orders from retail traders. These stop-losses become market sell orders, providing the liquidity big players need to fill their large buy orders. After absorbing this liquidity, the price often reverses sharply upward, trapping those who sold early.
Should I use daily or hourly charts for support and resistance?
It depends on your trading style. For swing trading or long-term investing, daily and weekly charts provide the most reliable levels. For day trading, 1-hour or 4-hour charts are more relevant. However, always check higher timeframes first. A daily support level is far more significant than an hourly one and should dictate your overall bias.
Can support and resistance predict future prices accurately?
They cannot predict the future with certainty, but they identify probable reaction zones. Technical analysis is about probability, not prediction. Support and resistance help you determine where the odds favor a reversal or continuation, allowing you to make informed decisions with defined risk parameters.


Comments (19)
Mekz Wheoki
June 10, 2026 AT 21:26 PMOh look, another article explaining the most basic concept in trading to people who probably just bought their first BTC at an all-time high. Support and resistance isn't a magic spell, it's just where other losers put their stop losses. But sure, keep drawing lines on your phone screen like it's art class.
Rob Aronson
June 11, 2026 AT 22:44 PMDude, chill with the negativity 🙄 The post actually breaks down the psychology behind the levels pretty well. Most newbies don't realize that S/R is basically a map of collective fear and greed. It’s not about the line itself, it’s about the liquidity sitting there waiting for you to get rekt if you don’t respect the zone. Always check volume before trusting a breakout though, otherwise you’re just feeding the whales 🐋📉
Jessica Lane
June 13, 2026 AT 20:23 PMI completely agree that understanding the psychological aspect is crucial for long-term success in this volatile market. It is fascinating how human behavior creates these self-fulfilling prophecies around round numbers like $65,000 or $100,000. When thousands of traders are looking at the same support level, their collective action reinforces the validity of that zone through increased order book depth. This dynamic interaction between individual sentiment and market structure is what makes technical analysis both an art and a science. We must remember that these levels are zones of probability rather than guaranteed outcomes, which requires discipline to manage risk effectively. By acknowledging the emotional drivers behind price action, we can approach our trades with greater clarity and less impulsive decision-making. It is important to stay calm during these fluctuations and trust the broader trend rather than getting caught up in short-term noise. Let us continue to learn from each other and refine our strategies based on empirical evidence and shared experiences within the community.
Andrea Burd
June 15, 2026 AT 13:26 PMlol wow. did u really need an entire essay to explain that prices go up and down? basic stuff for anyone who has traded more than 5 minutes. also ur grammar is kinda sus but whatever i guess its fine for reddit. dont take this too seriously tho cause markets are rigged anyway.
Amit Thakur
June 17, 2026 AT 11:48 AMListen here, you absolute novice. You think drawing a horizontal line on TradingView makes you a trader? It doesn't. The real game is reading the order flow and understanding where the institutional smart money is accumulating. Retail traders like you are just liquidity providers for the banks. They hunt your stops below support because they know you placed them there. If you cannot read the tape and understand delta divergence, you will remain a bagholder forever. Wake up.
Josh Dodson
June 17, 2026 AT 13:34 PMhey man no need to be so harsh lol. everyone starts somewhere right? i used to lose my shirt every time i tried to trade support bounces. now i just wait for the retest and it works way better for me. keep grinding and dont let the haters get u down 💪
Eric Scheinberg
June 18, 2026 AT 05:01 AMThe assertion that support and resistance are merely psychological constructs overlooks the fundamental mechanics of market microstructure. While sentiment plays a role, the primary driver is the aggregation of limit orders at specific price points creating natural barriers to immediate price movement. These levels represent equilibrium points where supply meets demand over significant periods. To dismiss the utility of these zones as simplistic is to ignore the historical precedent of price clustering. Furthermore, the concept of role reversal when a level is breached is a critical component of trend identification. One must analyze multiple timeframes to determine the significance of any given level. A daily support level carries far more weight than an hourly one due to the volume and time commitment involved in establishing it. Precision in defining these zones is essential for effective risk management.
John Doe
June 18, 2026 AT 14:43 PMI have been watching Bitcoin dance around that $65k mark for weeks now and it is driving me insane. Every time it gets close, I feel like I should buy, but then it dumps 2% and I panic sell. Then it rallies back up and I miss out. It feels like the market is personally targeting my wallet. I know I shouldn't trade emotionally, but it is hard when you see red candles everywhere. Does anyone else feel like they are being manipulated by some invisible hand? It is exhausting trying to predict where the next bounce will happen.
Fede Faith
June 20, 2026 AT 12:11 PMYou are definitely not alone in feeling that frustration. It is very common for traders to experience emotional turbulence when price action becomes choppy near key levels. The key is to step back and look at the bigger picture rather than focusing on every small wick. Try setting alerts for those key support and resistance zones instead of staring at the chart all day. This way, you can react calmly when the price hits your target area rather than making impulsive decisions based on fear or FOMO. Remember that patience is one of the most valuable traits in trading. Give yourself permission to sit on your hands until the setup is clear.
Kumaran sowkarpet
June 21, 2026 AT 03:45 AMBro, just use a wider stop loss and hold 😊 Many times the dip is just a shakeout to scare retail. I always say, HODL strong and the moon will come eventually. Don't let the bears win! Keep faith in the tech and the community. We are all in this together 🚀💎
Skm Shubham
June 22, 2026 AT 21:30 PMTypical degenerate mindset. Wide stop losses just mean you bleed out slower. If your thesis is wrong, you exit. There is no 'faith' in trading, only probability and execution. People like you are why exchanges make billions. You are gambling, not trading. Stop pretending that holding a losing position is a strategy. It is cowardice disguised as conviction. Learn to cut losses quickly or get out of the market entirely. Your emotional attachment to your bags is your biggest liability.
Manish Prajapat
June 24, 2026 AT 19:07 PMThere is a philosophical dimension to the concept of support and resistance that often goes unexplored. It reflects the dialectic nature of markets: thesis and antithesis. Support represents the thesis of value, while resistance embodies the antithesis of overvaluation. The synthesis occurs in the breakout or breakdown, leading to a new state of equilibrium. This cyclical process mirrors the broader patterns of history and human endeavor. Understanding this rhythm allows one to transcend mere technical analysis and engage with the deeper currents of economic reality. It is not just about lines on a chart; it is about recognizing the eternal struggle between hope and fear.
Danna Charris
June 25, 2026 AT 14:03 PMFascinating perspective. However, one must remain grounded in practical application. Theory without execution is merely intellectual exercise. The market does not care about your philosophy. It cares about your risk-reward ratio. Ensure your entries are precise and your exits are disciplined. That is the only truth that matters.
Mauricio Contreras Loredo
June 26, 2026 AT 07:50 AMOh great, another philosopher telling us how the market is a metaphor for life. Thanks, Captain Obvious. Meanwhile, I'm over here trying to figure out if this RSI divergence is real or just another fakeout trap. Can we please stick to actionable advice? Like, uh, maybe tell us which coin to buy? Or are we too busy contemplating the meaning of existence?
Suman Patil
June 27, 2026 AT 12:43 PMHey guys, let's keep it positive here! No need for the drama. The point of the article is to help us understand the basics so we can make better decisions. Whether you are a scalper or a hodler, knowing where the big boys are placing their orders helps avoid getting swept out. I've found that combining S/R with simple moving averages gives a clearer signal. For example, if price bounces off support AND the 50 EMA, that's a stronger entry. Let's share tips and help each other grow, not tear each other down. Crypto is tough enough without the toxicity. Stay cool and trade safe! 🤝
Nick Rice
June 29, 2026 AT 06:10 AMWhile the sentiment is appreciated, let us address the technical inaccuracies present in casual discussions. Relying solely on moving averages for confirmation is a lagging strategy that often results in late entries. True confluence comes from volume profile analysis and order book depth. If you are not analyzing the footprint charts, you are flying blind. I suggest studying auction market theory to understand why price moves to certain areas. It is not just about lines; it is about value acceptance and rejection. Educate yourselves properly before risking capital. The market rewards precision, not optimism.
pankaj chawla
June 30, 2026 AT 19:21 PMI agree with the emphasis on education. Many traders skip the foundational concepts and jump straight into complex indicators. Mastering support and resistance is the first step. Once you understand how price reacts to these levels, adding volume and momentum indicators becomes much more intuitive. Collaboration and sharing knowledge are key to improving as a community. Let us focus on constructive feedback and continuous learning.
Kwon Bill
July 2, 2026 AT 17:39 PMIn Asian markets, we often see different behaviors around round numbers compared to Western markets. The cultural perception of certain digits can influence order placement. For instance, numbers ending in 8 or 9 might attract more attention in some regions. This adds another layer of complexity to global crypto trading. It is important to be aware of these regional nuances when analyzing support and resistance levels across different exchanges. Understanding the diverse participant base enriches our analytical framework.
sreeja boora
July 2, 2026 AT 21:31 PMThe integrity of our financial systems must be upheld. Speculative trading in cryptocurrencies poses significant risks to national economic stability. We should prioritize regulated assets and traditional investment vehicles. The volatility inherent in digital currencies undermines the confidence of prudent investors. It is imperative that we advocate for stricter regulations to protect citizens from such unstable instruments. Our focus should be on sustainable growth and secure investments.